I read a lot of tweets. No, really. A lot. No no no, you don’t hear me properly. Really. A. Lot.
Not that I ever get to read the avalanche of tweets entering my stream, although I do go through it cursory somewhat daily. I even occasionally write something myself. But mainly, I analyse tweets. Millions of them.
Doing that can be quite daunting/discouraging at times, of course. There’s a lot of … erhmm … not too politically correct tweets out there. But generally, it’s just ridiculously interesting and useful. And a truckload of fun!
Having previously worked in (social media) communications for quite a few years, one of the things that surprise me repeatedly is the scattered use of campaign hashtags. Or, rather, that social media communications campaign people “create” hashtags for this, that and everything. Or “take ownership” of a conversation via hashtags. It makes it easier to track, sure, but next to nowhere else does the user have to “pay” for campaign complacency. It’s bad form.
Although I haven’t really researched the effectiveness of different uses of hashtags, I would be utterly surprised to see that the use of about a gazillion hashtags promoting the same issue does anyone any good. You only have 140 characters, right? Why would you think that people would try to fit in all of #eventX, #eventX2013 and #eventXsessionY in one tweet?
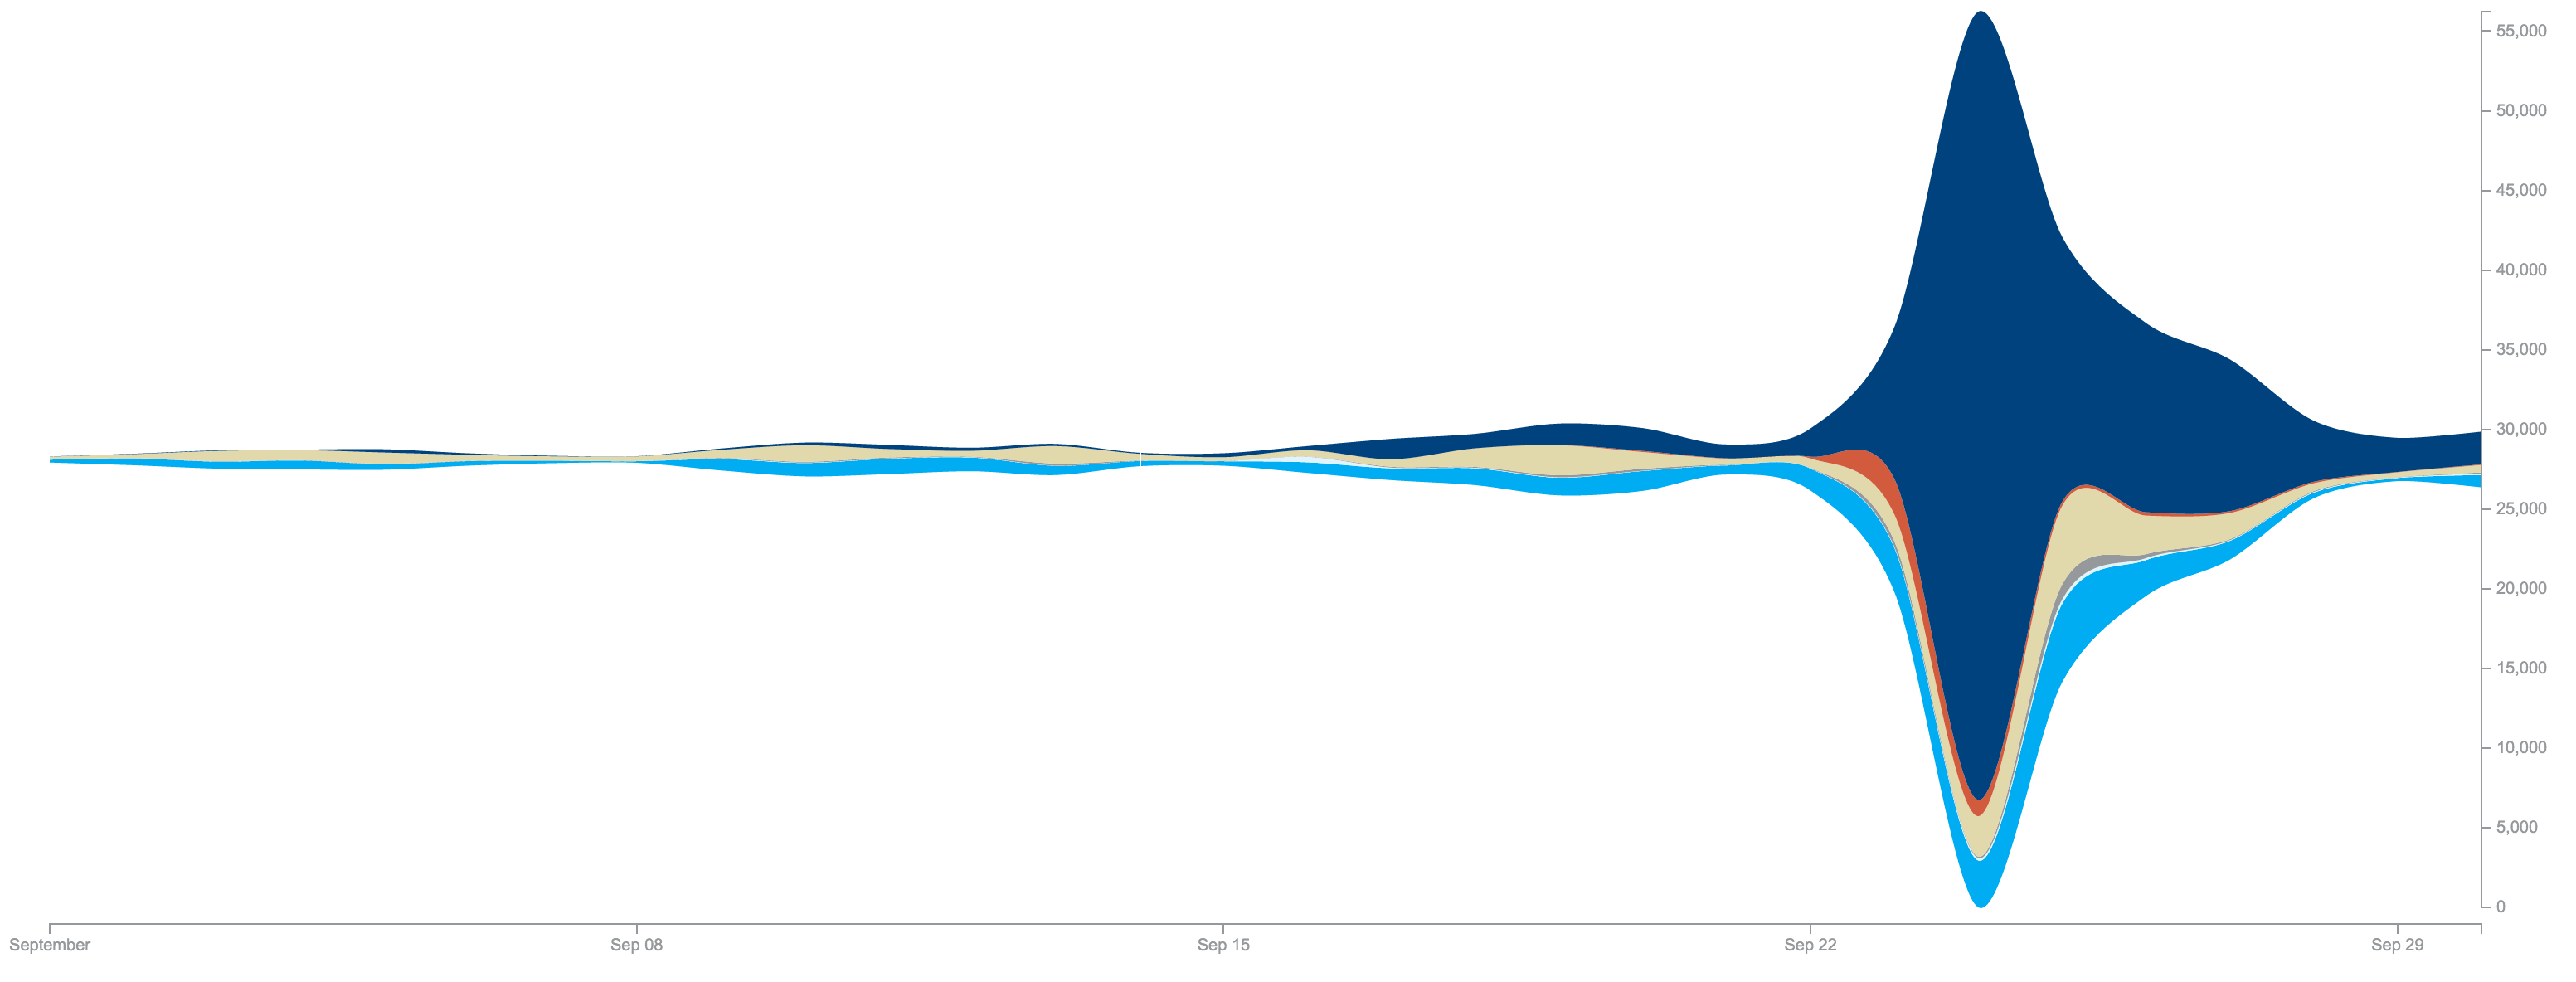
Anyway, that was just a stray thought while doing the below explorations. I know there are good reasons for any of the hashtags I’ve tracked around the UN General Assembly 2013, but it does seem they’re generally competing, not being used in conjunction. That said, #MDGs and #post2015 seem to be used a lot together, and that surely does make a lot of sense. And soon we’ll probably see #SDGs take over both.
The most interesting thing to me is probably that #MDGs and #post2015 are used as intended: They’re being used during the whole period as topic keywords, whereas the other hashtags analysed are event hashtags and only supposed to be used for a few days.
Tweets per Hashtag
Trends by hashtag around GA Week
Long-term trends (2009-2013)
This streamgraph shows the daily number of tweets using each of these 6 hashtags: #UNGA, #FutureWeWant, #MDGMomentum, #MDGs, #MDGSuccess, and #post2015. The total height of each stream on any day indicates the volume. Although the graph centers around the middle, there are no negative values.
[html collapse="true"]
<!DOCTYPE html>
<meta charset="utf-8">
<link href='http://fonts.googleapis.com/css?family=Open+Sans:400,300' rel='stylesheet' type='text/css'>

<style>

body {
  font: 300 10px "Open Sans", Arial, sans-serif;
  font-color: #96999b;
}

.axis path, .axis line {
  fill: none;
  stroke: #96999b;
  stroke-width: 1px;
  shape-rendering: crispEdges;
}

.tick {
  fill: #96999b;
}

button {
  position: absolute;
  right: 50px;
  top: 10px;
}

</style>

<body>
<script src="http://d3js.org/d3.v3.js"></script>

<div class="chart">
</div>

<script>

chart("sep2013.csv", "globalpulse");

var datearray = [];
var colorrange = [];

function chart(csvpath, color) {

if (color == "globalpulse") {
  colorrange = ["#00aeef", "#e1f4fd", "#96999b", "#e1d8ad", "#cf5c42", "#00447c", "#f4d5e3"];
}
else if (color == "blue") {
  colorrange = ["#045A8D", "#2B8CBE", "#74A9CF", "#A6BDDB", "#D0D1E6", "#F1EEF6"];
}
else if (color == "pink") {
  colorrange = ["#980043", "#DD1C77", "#DF65B0", "#C994C7", "#D4B9DA", "#F1EEF6"];
}
else if (color == "orange") {
  colorrange = ["#B30000", "#E34A33", "#FC8D59", "#FDBB84", "#FDD49E", "#FEF0D9"];
}
strokecolor = colorrange[0];

var format = d3.time.format("%m/%d/%y");

var margin = {top: 20, right: 60, bottom: 30, left: 30};
var width = document.body.clientWidth - margin.left - margin.right;
var height = 600 - margin.top - margin.bottom;

var tooltip = d3.select("body")
    .append("div")
    .attr("class", "remove")
    .style("position", "absolute")
    .style("z-index", "20")
    .style("visibility", "hidden")
    .style("top", "30px")
    .style("left", "30px");

var x = d3.time.scale()
    .range([0, width]);

var y = d3.scale.linear()
    .range([height-10, 0]);

var z = d3.scale.ordinal()
    .range(colorrange);

var xAxis = d3.svg.axis()
    .scale(x)
    .orient("bottom")
    .ticks(d3.time.days);

var yAxis = d3.svg.axis()
    .scale(y);

var yAxisr = d3.svg.axis()
    .scale(y);

var stack = d3.layout.stack()
    .offset("silhouette")
    .values(function(d) { return d.values; })
    .x(function(d) { return d.date; })
    .y(function(d) { return d.value; });

var nest = d3.nest()
    .key(function(d) { return d.key; });

var area = d3.svg.area()
    .interpolate("cardinal")
    .x(function(d) { return x(d.date); })
    .y0(function(d) { return y(d.y0); })
    .y1(function(d) { return y(d.y0 + d.y); });

var svg = d3.select(".chart").append("svg")
    .attr("width", width + margin.left + margin.right)
    .attr("height", height + margin.top + margin.bottom)
  .append("g")
    .attr("transform", "translate(" + margin.left + "," + margin.top + ")");

var graph = d3.csv(csvpath, function(data) {
  data.forEach(function(d) {
    d.date = format.parse(d.date);
    d.value = +d.value;
  });

  var layers = stack(nest.entries(data));

  x.domain(d3.extent(data, function(d) { return d.date; }));
  y.domain([0, d3.max(data, function(d) { return d.y0 + d.y; })]);

  svg.selectAll(".layer")
      .data(layers)
    .enter().append("path")
      .attr("class", "layer")
      .attr("d", function(d) { return area(d.values); })
      .style("fill", function(d, i) { return z(i); });

  svg.append("g")
      .attr("class", "x axis")
      .attr("transform", "translate(0," + height + ")")
      .call(xAxis);

  svg.append("g")
      .attr("class", "y axis")
      .attr("transform", "translate(" + width + ", 0)")
      .call(yAxis.orient("right"));

//  svg.append("g")
//      .attr("class", "y axis")
//      .call(yAxis.orient("left"));

  svg.selectAll(".layer")
    .attr("opacity", 1)
    .on("mouseover", function(d, i) {
      svg.selectAll(".layer").transition()
      .duration(250)
      .attr("opacity", function(d, j) {
        return j != i ? 0.6 : 1;
    })})

    .on("mousemove", function(d, i) {
      mousex = d3.mouse(this);
      mousex = mousex[0];
      var invertedx = x.invert(mousex);
      invertedx = invertedx.getMonth() + invertedx.getDate();
      var selected = (d.values);
      for (var k = 0; k < selected.length; k++) {
        datearray[k] = selected[k].date
        datearray[k] = datearray[k].getMonth() + datearray[k].getDate();
      }

      mousedate = datearray.indexOf(invertedx);
      pro = d.values[mousedate].value;

      d3.select(this)
      .classed("hover", true)
      .attr("stroke", strokecolor)
      .attr("stroke-width", ".5px"),
      tooltip.html( d.key + ": " + pro )
      	.style("visibility", "visible")
      	.style("color", "#FFF")
      	.style("font-size", "40px")
      	.style("background", function(d, i) { return z(i); });

    })
    .on("mouseout", function(d, i) {
     svg.selectAll(".layer")
      .transition()
      .duration(250)
      .attr("opacity", "1");
      d3.select(this)
      .classed("hover", false)
      .attr("stroke-width", "0px"), tooltip.html( "

" + d.key + "
" + pro + "

" ).style("visibility", "hidden");
  })

  var vertical = d3.select(".chart")
        .append("div")
        .attr("class", "remove")
        .style("position", "absolute")
        .style("z-index", "19")
        .style("width", "3px")
        .style("height", "600px")
        .style("top", "10px")
        .style("bottom", "30px")
        .style("left", "0px")
        .style("background", "#00aeef");

  d3.select(".chart")
      .on("mousemove", function(){
         mousex = d3.mouse(this);
         mousex = mousex[0] + 5;
         vertical.style("left", mousex + "px" )})
      .on("mouseover", function(){
         mousex = d3.mouse(this);
         mousex = mousex[0] + 5;
         vertical.style("left", mousex + "px")});
});
}
</script>
[/html]
Hover over the graph to see the number of tweets using that hashtag on that day.
